Your valuable feedback will be used to monitor customer satisfaction, so as to ensure that services are delivered consistently. If you have any queries please feel free to contact our 24/7 helpline at 111-113-442.
Thank you
Thank you for completing this form.
Thankyou for highlighting your concern to us you will soon to be contacted by our customer service representive
Thank you
Thank you for writing us.
Our team will coordinate with you accordingly.
Thank you
Thanks for taking the time to apply.
Our team will coordinate with you, If criteria is matched.
Thank you
Thank you for contacting us.
Our team will coordinate with you accordingly. In case of urgency, please feel free to contact our 24/7 helpline at 111-113-442.
Thank you
Thank you for Submitting this form.
As soon as bank receives above required information bank sales representative shall contact you as early as possible
Thank you
We are happy to note that you have not encountered any problem at Al Baraka Bank (Pakistan) Limited. However for any further assistance please feel free to contact our 24/7 helpline at 111-113-442 or visit our nearest branch.
Thank you
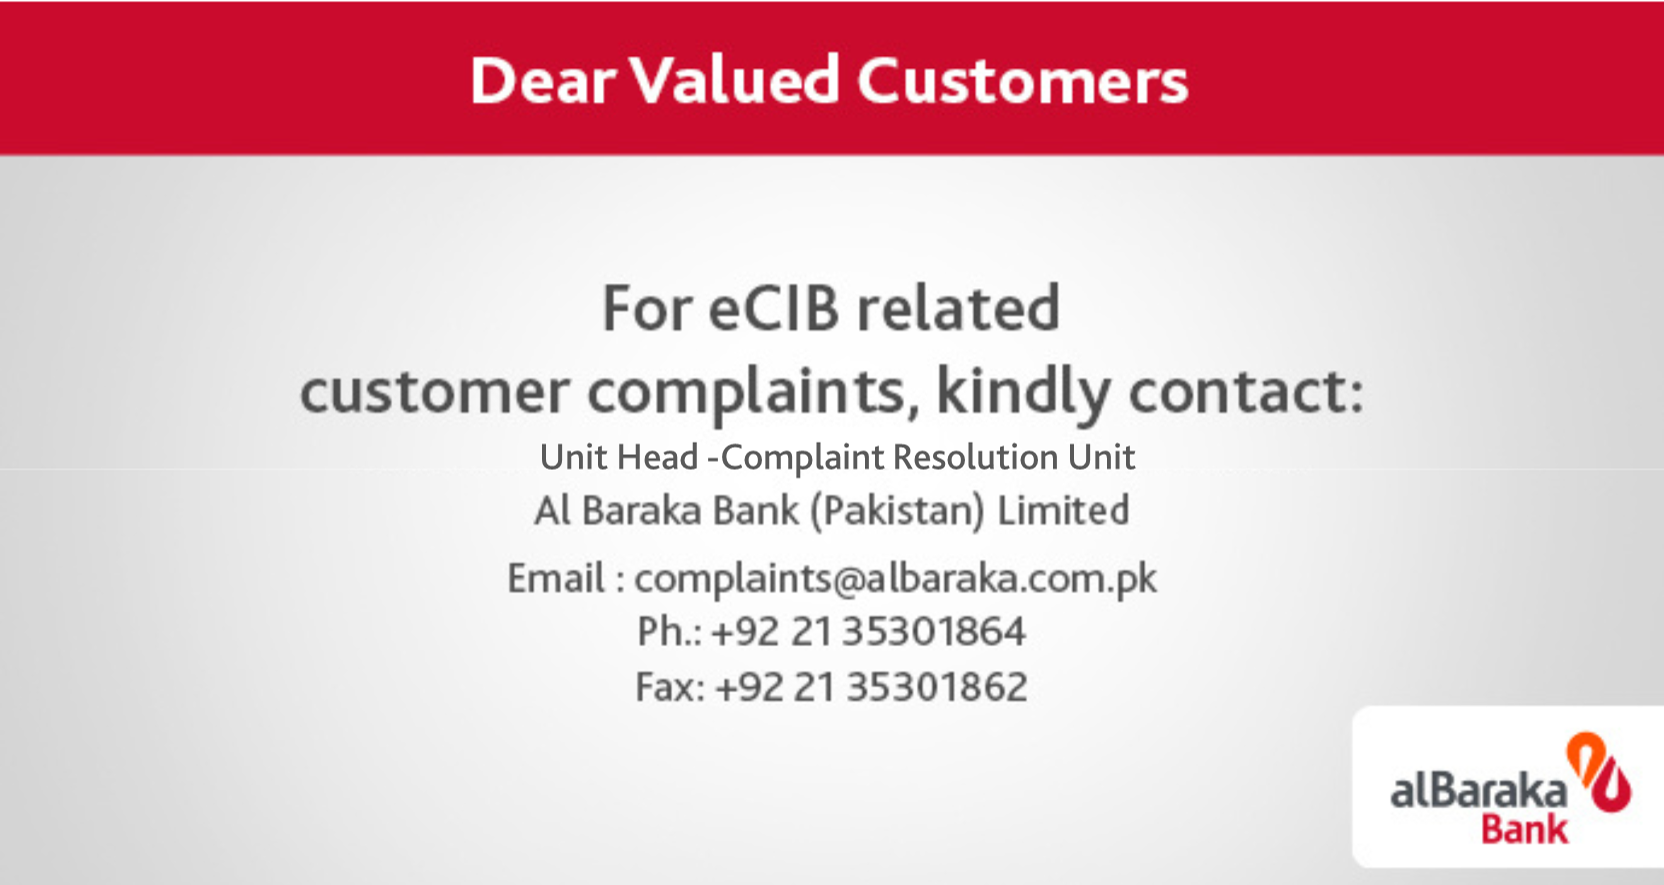
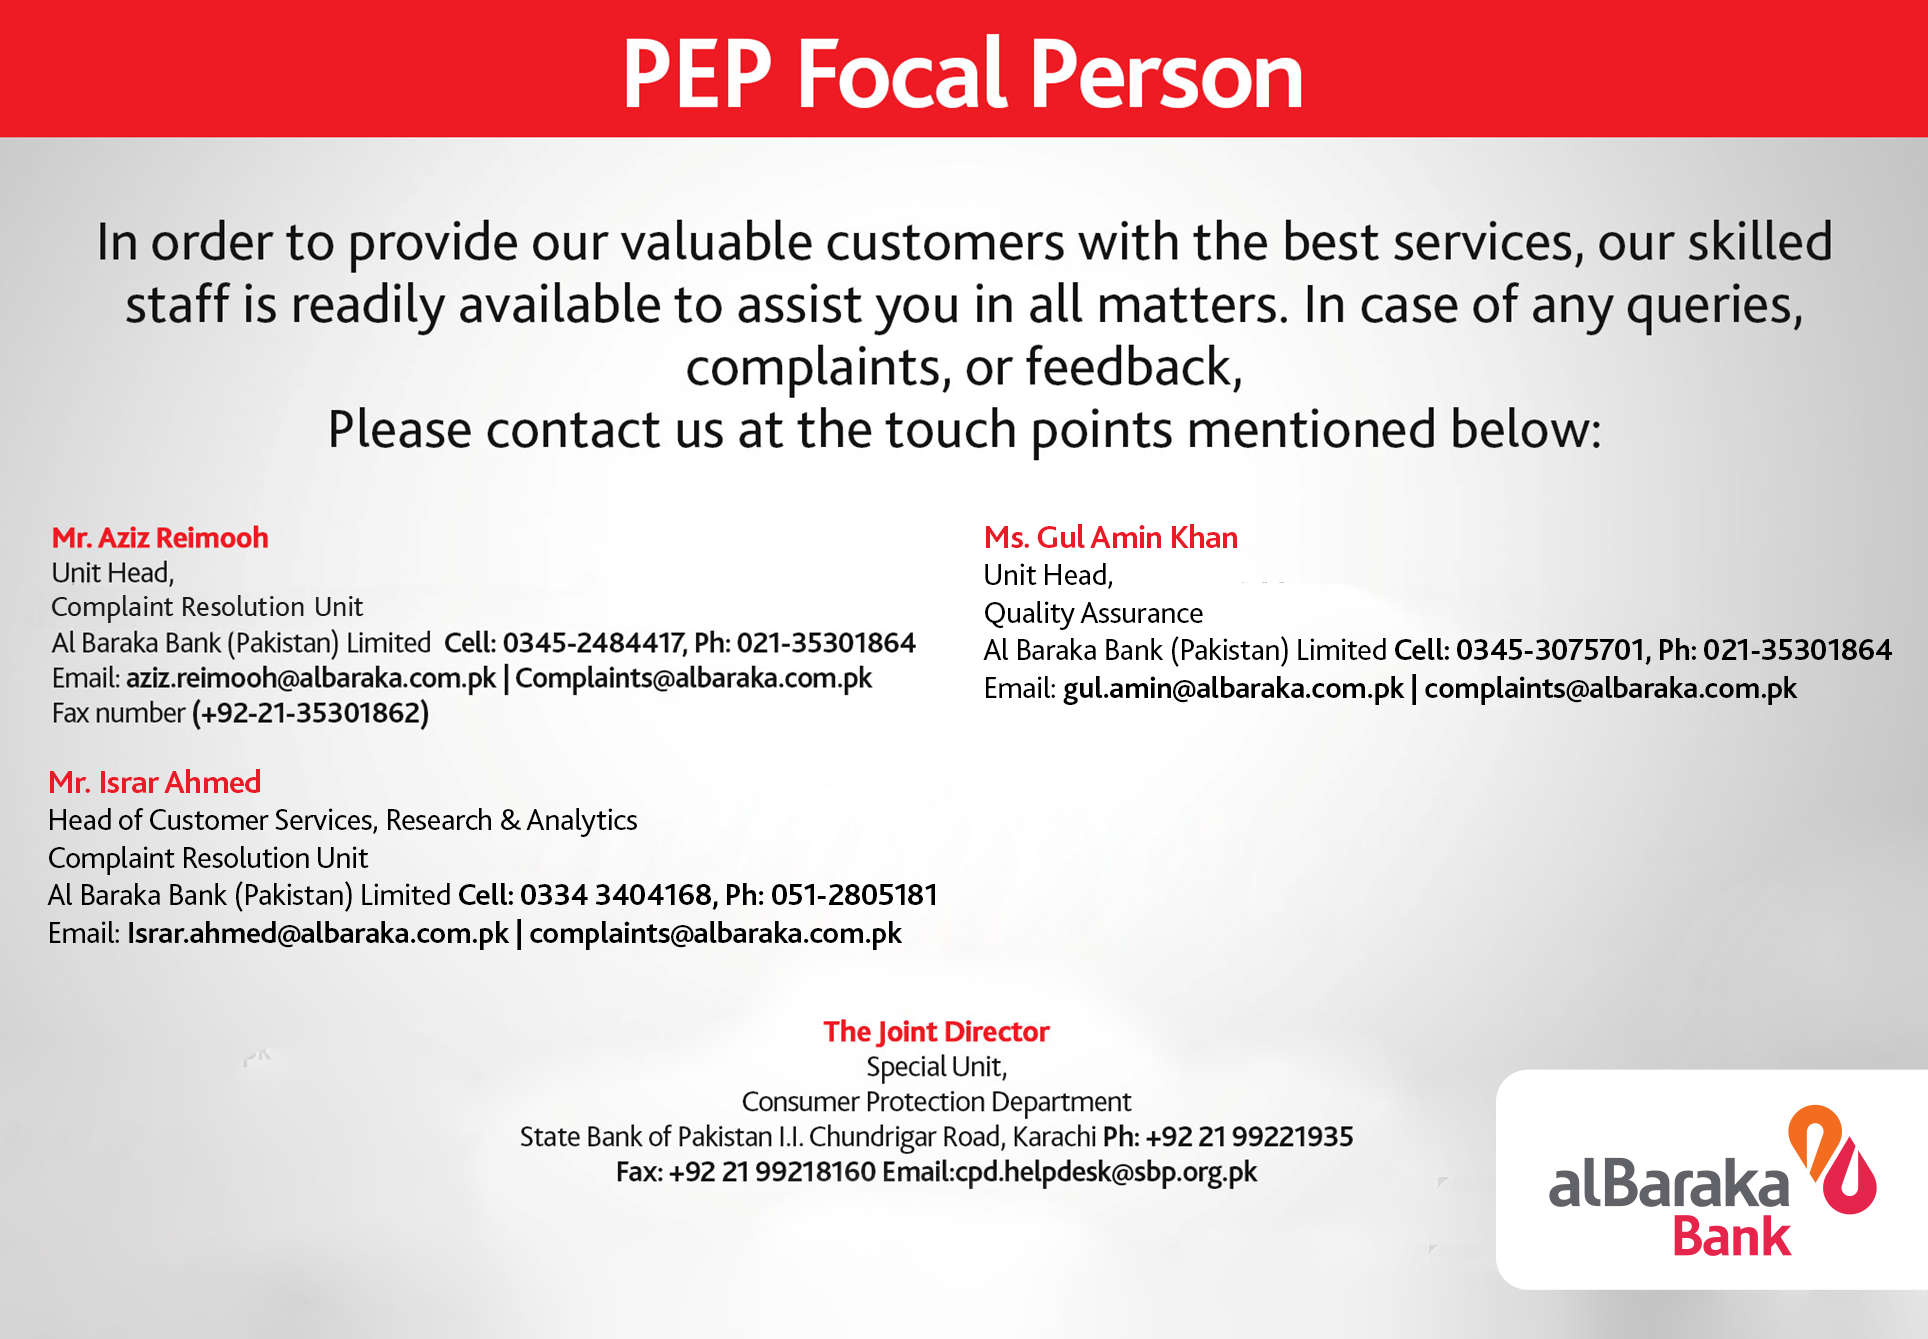
Thank you for your valuable feedback. In case your complaint/grievance still persist, please feel free to write us at : complaints @albaraka.com.pk. You may also contact our 24/7 helpline at 111-113-442 or visit our nearest branch.